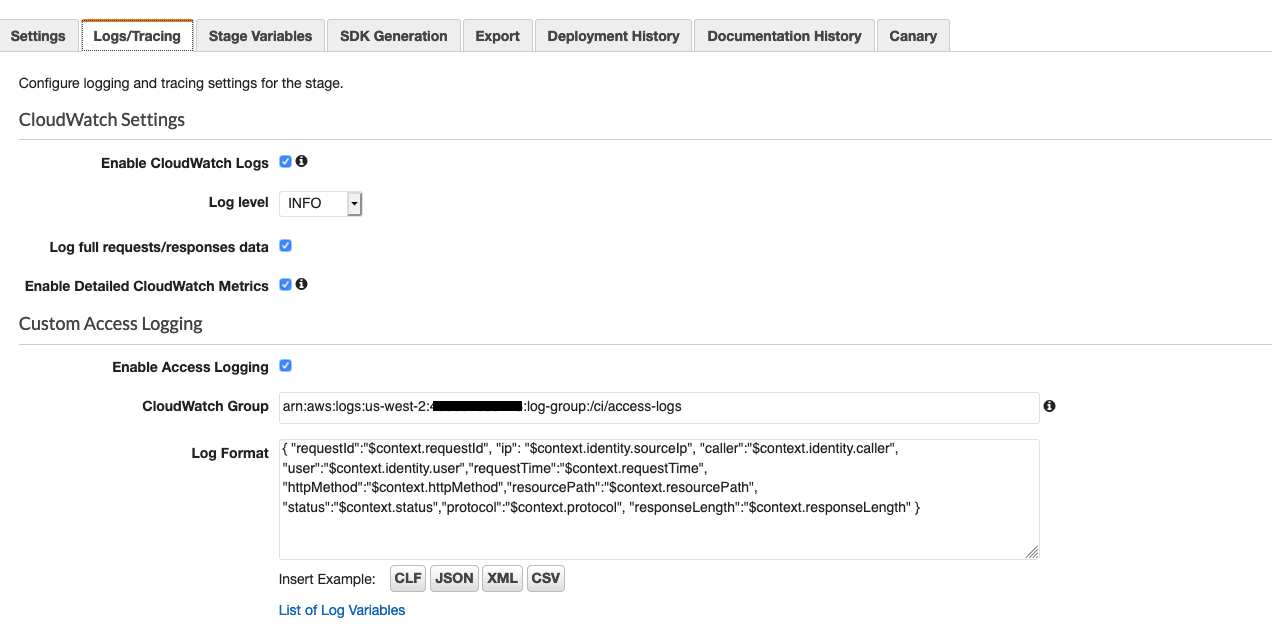
The first thing to do is to enable logging in your API Gateway. If you are using AWS SAM Cloud Formation you will not be able to automate this step at this time. Instead, using the Console, go to your API Gateway pages and select stages on the left. Then select the stage of your deployment you wish to have logs for. Then select the Logs/Tracing table and enable logs in JSON format by clicking on JSON.
Once you have specified this, you will begin to have access logs sent to the ARN you have set up.
Since you have chosen JSON format CloudWatch Insights will automatically be able to identify the fields and help you to write queries. From the Cloudwatch Logs console you can click on explore and then you can start to play. Here are few queries we used to get you started, which help us break down our 5xx errors:
This simple line allows will only look for requests whose status is 5xx and then display the url, status, time in 5 minute intervals and the number of such requests that appeared during that interval.
filter status >= 500 and status <= 599
| stats count(*) as count by resourcePath as url, status, bin(5m)
Once you have this you can click on the button "Add to Dashboard" so that you can have a dashboard to track this data.
And if you just want the dashboard without playing here is a CloudFormation template you can use: